
Opening Scene
A city map shows you streets and intersections, but a good tour guide tells you what those streets actually mean: “this used to be the old fish market,” “locals call this square something different than the official name,” “these two neighborhoods feel separate but were originally one.” The map is accurate. The tour guide is what makes it meaningful.
A data model is the map. What’s often missing is the tour guide — the shared layer of meaning that tells everyone, consistently, what the map’s labels actually mean and how the places on it truly relate.
In Plain English
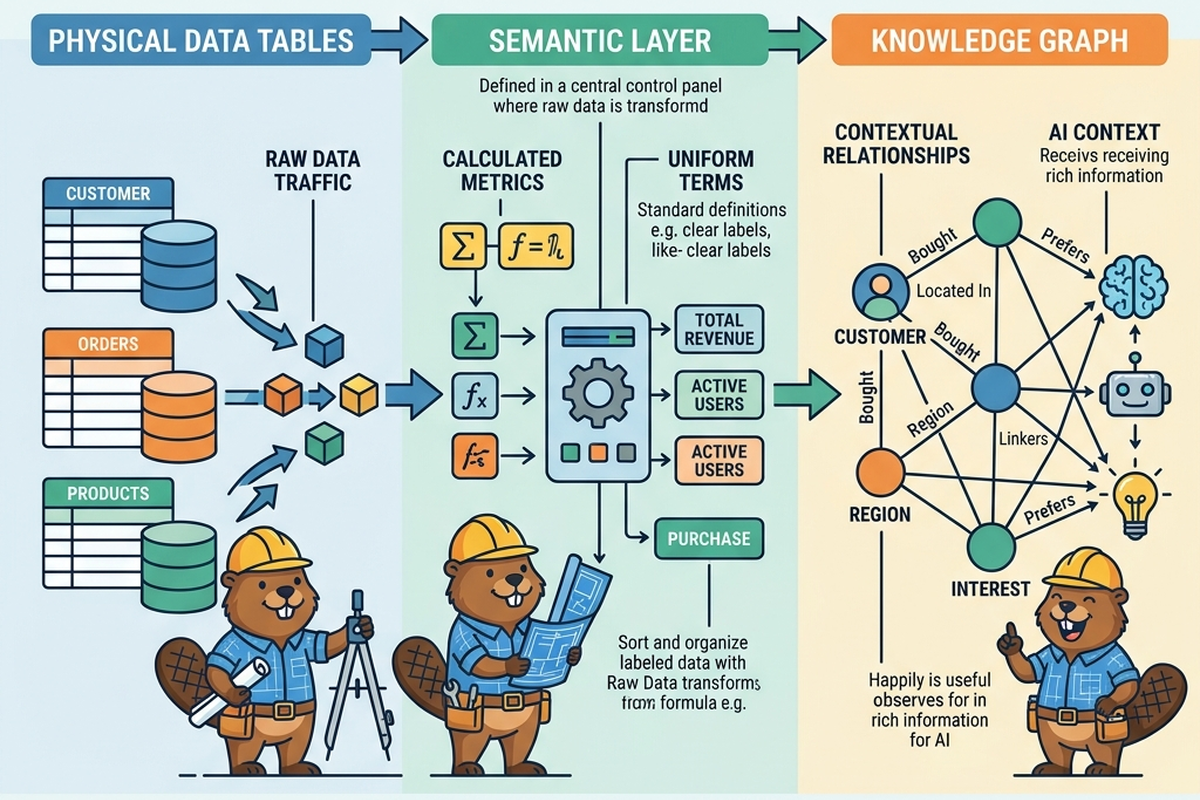
A semantic layer sits on top of a data model and defines, once and consistently, what business terms actually mean (“revenue” means exactly this calculation, every time, everywhere it’s used) so different people and tools don’t quietly disagree. A knowledge graph goes a step further, explicitly capturing meaningful relationships between things — not just “these tables are joined on this key,” but “this concept is related to that concept in this specific way” — closer to a network of annotated stories than a simple map of streets.
The Old Way
Traditionally, the meaning behind a data model lived mostly in people’s heads, in scattered documentation, or worst of all, in the specific logic buried inside individual reports. Two different teams might both calculate “monthly active users” slightly differently, neither one wrong exactly, but neither one fully agreeing with the other either — like two tour guides giving genuinely different histories of the same street, both partially right.
Where semantic layers existed, they were often built and maintained manually, requiring real ongoing discipline: someone had to notice when a new metric was introduced, define it consistently, and make sure every report or tool that used it actually pulled from the shared definition rather than reinventing its own version. This discipline was valuable but easy to let slip, especially under deadline pressure.
What’s Changing (and Why AI Is the Reason)
- The tour guide is briefing more visitors than ever, including AI ones. As AI chatbots and copilots increasingly answer business questions directly, they rely on the semantic layer to know what “revenue” or “active customer” actually means — without it, an AI assistant may confidently produce a plausible-sounding but incorrect answer, with no obvious sign anything went wrong.
- Building and maintaining the semantic layer itself is getting AI assistance. Tools can now scan existing reports, queries, and documentation to surface inconsistent metric definitions across an organization, and propose a reconciled, shared definition — the AI equivalent of comparing multiple tour guides’ scripts and flagging where they disagree.
- Knowledge graphs are becoming more practical to build and maintain at scale. AI tools can now help extract meaningful relationships from large volumes of data and documentation that would have taken specialist teams a long time to map manually, making the “annotated tour” approach realistic for far more organizations than it used to be.
The Metaphor, Fully Extended
| City Tour Guide Element | Semantic Layer / Knowledge Graph Concept |
|---|---|
| The city map itself | The underlying data model |
| The tour guide’s narration | The semantic layer (shared business meaning) |
| A landmark’s official name vs. what locals actually call it | Inconsistent metric definitions across teams |
| The tour guide’s annotated stories connecting landmarks | A knowledge graph’s meaningful relationships between concepts |
| A new tour guide trainee learning the “real” stories | A new analyst learning the organization’s true metric definitions |
| Comparing multiple guides’ scripts to catch disagreements | AI tools detecting inconsistent definitions across reports and queries |
| A tourist asking a guide a question and trusting the answer | A business user asking an AI assistant a question and trusting the answer |
| A guide who doesn’t know a particular street well, but answers confidently anyway | An AI assistant answering confidently without a reliable semantic layer to draw from |
| Updating the official tour script after a city renovation | Updating the semantic layer after a schema or business change |
| A detailed historical society’s archive, cross-referencing everything | A mature knowledge graph capturing rich, explicit relationships |
For Beginners: What to Actually Do
- Get in the habit of asking “is this metric defined the same way everywhere?” any time you see a number like “active users” or “revenue” reported in more than one place.
- Before trusting an AI assistant’s answer to a business question, ask where its definition of key terms is coming from — a well-governed semantic layer, or its own best guess from the raw data.
- Practice writing a clear, precise definition for one metric you use regularly, the way a tour guide might script an explanation for tourists — note every assumption baked into the calculation.
- Treat any “this number doesn’t match that report” discrepancy you encounter as a possible semantic layer gap worth raising, not just an annoyance to work around quietly.
For Practitioners and Leaders: The Deeper Layer
- As AI copilots become a primary interface to business data, the semantic layer shifts from “nice governance hygiene” to a genuine trust and safety concern — an ungoverned or inconsistent semantic layer means AI tools will produce confident, plausible, sometimes wrong answers with no visible warning sign, often to non-technical users least equipped to catch the error.
- AI-assisted detection of inconsistent metric definitions across an organization’s existing reports is one of the higher-leverage uses of AI in this space right now — it surfaces a problem that previously required tedious, often political, manual reconciliation work across teams.
- Knowledge graphs add real value where relationships matter more than raw structure (e.g., regulatory relationships, fraud detection, recommendation systems), but building one well still requires deliberate scoping — AI-assisted extraction accelerates construction, but doesn’t replace the judgment of deciding which relationships are actually worth capturing.
- Treat semantic layer governance as an ongoing discipline, not a one-time project — AI tooling makes maintenance easier, but the underlying need for clear ownership of metric definitions, and a process for handling disagreements, hasn’t gone away.
Quick Recap
- A semantic layer defines business terms consistently across an organization, so different teams and tools agree on what things mean.
- A knowledge graph captures explicit, meaningful relationships between concepts, going beyond simple table joins.
- Historically, shared meaning lived in people’s heads or scattered documentation, easy to let drift inconsistently over time.
- AI assistants are now a major consumer of the semantic layer — their accuracy depends directly on its quality.
- AI tools can help detect inconsistent definitions and accelerate knowledge graph construction, but governance and judgment remain human responsibilities.
Where This Fits in the Series
Article 8 looked at how AI assists with drafting the model itself; this article looked at the layer of shared meaning built on top of that model, increasingly critical as AI tools become primary consumers of it. Article 10, “The City, Reassembled,” brings the whole series together, returning to the city metaphor from Article 1 and walking through every article’s metaphor as a neighborhood of the same place.
Subscribe to the Newsletter
Get the latest DataParables articles delivered straight to your inbox.