Opening Scene
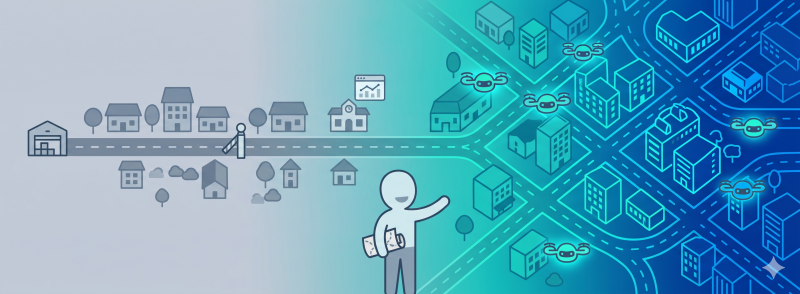
Picture a small town built around one main road. Goods arrive at one end — the farm, the factory, the train station — and travel down that single road, through a few checkpoints, until they reach the town square, where people pick up what they need. For decades, that one road was enough. Everyone knew where to stand, what time the deliveries came, and who to ask if something was missing.
Now imagine that town suddenly grows into a city. New neighborhoods spring up on every side. Delivery drones start picking up packages mid-route instead of waiting for them to reach the square. Self-driving vehicles need to read the road signs themselves, not just follow a person who already knows the way. The single main road doesn’t disappear — but it’s no longer enough, and pretending it still is causes traffic jams everywhere.
That town is your analytics architecture. The single main road is the traditional “data stack.” The city it’s turning into is what this series calls the analytics fabric. And the self-driving vehicles are AI.
In Plain English
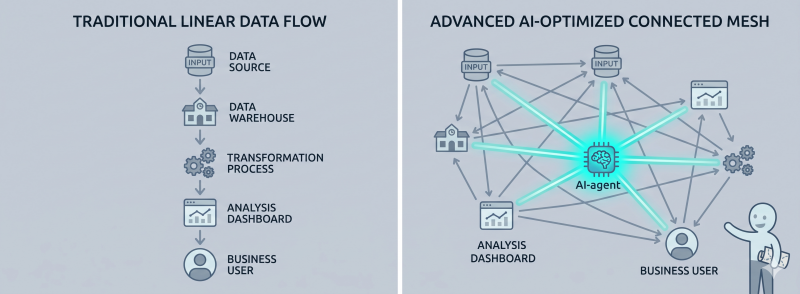
A data stack is just the path your data travels: from where it’s created, to where it’s stored and cleaned, to the chart someone eventually looks at. Traditionally, that path was one-directional and had one kind of “customer” waiting at the end: a human looking at a report.
An analytics fabric is what happens when that single path turns into a connected network — because now there are multiple kinds of “customers” (people and AI systems) who need to get to the data from different directions, not just one.
The Old Way
The classic analytics stack looks like this, and you’ve probably drawn it on a whiteboard yourself:
Source → Ingestion → Warehouse → Transformation → BI Dashboard → Human
Like the one-road town, this worked because everything moved in one direction, toward one kind of destination: a chart, table, or report that a person would open, read, and act on. Every part of the system was built around that single, predictable trip:
- The warehouse was the town’s central storage depot.
- Transformation jobs were the checkpoints, cleaning and organizing goods before they moved on.
- The BI tool was the town square — the one place everyone gathered to pick things up.
- The analyst was the person at the square, deciding what to do with what arrived.
It’s a sensible design if you only ever need to get goods from the edge of town to the square. For a long time, that was true.
What’s Changing (and Why AI Is the Reason)
Three things are happening in our city all at once, and they all trace back to AI:
1. There’s a new kind of resident who doesn’t wait at the square. AI agents now go directly to where the data lives — querying a database, summarizing a document, flagging something unusual — without ever passing through the town square (the dashboard). A system built only to deliver goods to the square doesn’t know what to do when someone shows up wanting goods delivered straight to their door instead.
2. Deliveries are getting “improved” mid-route, not just at the checkpoint. In the old town, all the sorting and cleaning happened at the checkpoint near the warehouse. Now, AI-powered enrichment can happen almost anywhere along the route — a delivery truck might tag, classify, or translate goods while still moving, instead of waiting for the checkpoint. Intelligence isn’t one stop on the road anymore; it can show up at any stop.
3. The roads themselves are no longer one-way. A self-driving delivery drone might pick up something from the warehouse, drop part of it at a neighborhood, and report back to the depot — all without ever routing through the square. That’s a fundamentally different traffic pattern than “everything flows one way to one destination,” and it’s exactly what’s happening when AI agents read from a semantic layer, write enrichments back into a database, and trigger an alert, all in one loop.
This is the shift: from a single road to a connected city — from a stack to a fabric.
The Metaphor, Fully Extended
| The City (Metaphor) | The Architecture (Technical) |
|---|---|
| The one main road | The traditional linear data stack |
| The town square | The BI dashboard — the single, expected “destination” |
| The checkpoint near the warehouse | Transformation/ETL jobs — where data is cleaned |
| The central storage depot | The data warehouse or lakehouse |
| The person at the square reading the delivery manifest | The human analyst reading a report |
| New neighborhoods popping up everywhere | New consumption points — apps, agents, embedded analytics — not just dashboards |
| Self-driving delivery drones | AI agents that query, move, and act on data directly |
| Drones reading road signs instead of asking a person | AI agents reading a semantic layer / metadata instead of relying on a human-curated dashboard |
| A well-labeled street sign on every corner | Clear, structured metadata — necessary for both people and machines to navigate |
| A city traffic control center coordinating all routes | Governance and lineage tracking, watching activity across the whole network, not just at the square |
This table is worth re-reading slowly — almost every architecture decision discussed in this series maps back to a version of “is this still a one-road town, or are we actually building a city?”
For Beginners: What to Actually Do
If you’re early in your analytics career, you don’t need to redesign anyone’s architecture tomorrow. But here’s what to start noticing:
- Ask where your data’s “front door” really is. Is it only the dashboard, or are other tools (and increasingly, AI assistants) also pulling from the same data directly? If you don’t know, ask — it tells you how many “neighborhoods” your city already has.
- Get comfortable with the idea of metadata as a street sign, not paperwork. Column descriptions, data dictionaries, and business definitions aren’t busywork — they’re literally what lets anyone (or anything) navigate without getting lost. Writing a good description is the same skill as putting up a clear street sign.
- Notice when “tribal knowledge” is doing the job a system should be doing. If the only way to know what a field means is to ask a specific coworker, that’s a town with no street signs — fine for a while, but it won’t scale, and AI tools definitely can’t “just ask Dave.”
For Practitioners and Leaders: The Deeper Layer
For those building or overseeing the architecture itself, the fabric model changes a few concrete design priorities:
- The semantic layer graduates from “nice to have” to load-bearing infrastructure. It’s no longer just a translation step before a dashboard — it’s the shared map that both human tools and AI agents query directly. That means the precision and documentation standards for it need to rise significantly; ambiguity that a human analyst could mentally patch over will trip up an AI agent badly.
- Access patterns are no longer purely hierarchical. Plan for agents that read, enrich, and write back at multiple points, not just at the top of a funnel. This has real implications for caching, write conflicts, and versioning that the old one-way stack never had to consider.
- Governance has to be ambient, not a single gate. In the one-road town, you could post one inspector at the checkpoint and call it done. In a city, you need traffic rules everywhere — lineage tracking, access control, and audit trails distributed across the fabric, not just bolted onto the dashboard layer. (We’ll go deep on this in Article 4.)
- Treat this as a chance to fix old debt, not just add complexity. Sloppy metadata and undocumented logic were a tolerable weakness when only humans were consuming the data. They become an active blocker once AI agents are consuming it too — which means fixing them now pays off for your human analysts as much as for any AI initiative.
Quick Recap
- The traditional data stack is built like a one-road town: one direction, one destination (the BI dashboard), one kind of traveler (a human analyst).
- AI is turning that town into a city — multiple destinations, multiple kinds of travelers (humans and AI agents), and traffic flowing in more than one direction.
- This connected, multi-directional model is the analytics fabric — not a replacement for the stack’s components, but a new way they relate to each other.
- The semantic layer becomes the city’s street-sign system: critical infrastructure both people and AI rely on to find their way.
- Good metadata and governance were always good practice — AI just made them non-optional.
Where This Fits in the Series
This article lays the foundation for everything else in the series. Next, in Article 2, we’ll zoom into that “street sign system” itself — why your data model now needs to be designed for a second kind of reader (AI), and what changes when you take that seriously. From there, Article 3 looks at how the checkpoint itself is changing (ETL becoming ETA: Extract, Transform, Augment), and Article 4 covers how a city builds traffic rules that actually hold up — governance for an architecture where intelligence can act anywhere, not just at one gate.
Subscribe to the Newsletter
Get the latest DataParables articles delivered straight to your inbox.